
Introduction
Overview of Power BI
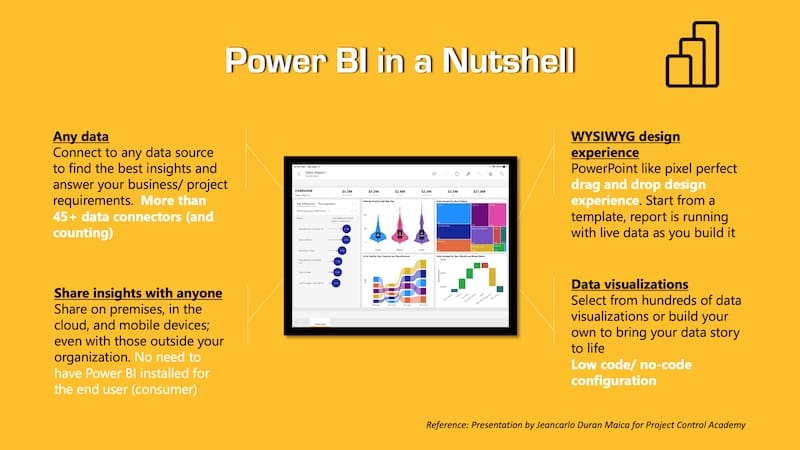
Power BI, a powerful business analytics solution from Microsoft, revolutionizes how organizations visualize and analyze data. With its intuitive interface, users can effortlessly transform raw data into compelling visual reports, making insights accessible to everyone, not just data experts. Imagine being able to pull data from various sources, create stunning dashboards, and share them across your team with just a few clicks!
Importance of Business Analytics
In today’s data-driven world, leveraging business analytics is crucial for making informed decisions. With tools like Power BI, companies can:
- Identify trends: Spot patterns over time to adjust strategies.
- Boost productivity: Minimize the time spent on reports.
- Enhance collaboration: Share insights seamlessly across departments.
By utilizing Power BI, organizations can remain agile and responsive in competitive markets, ensuring they stay ahead of the curve.
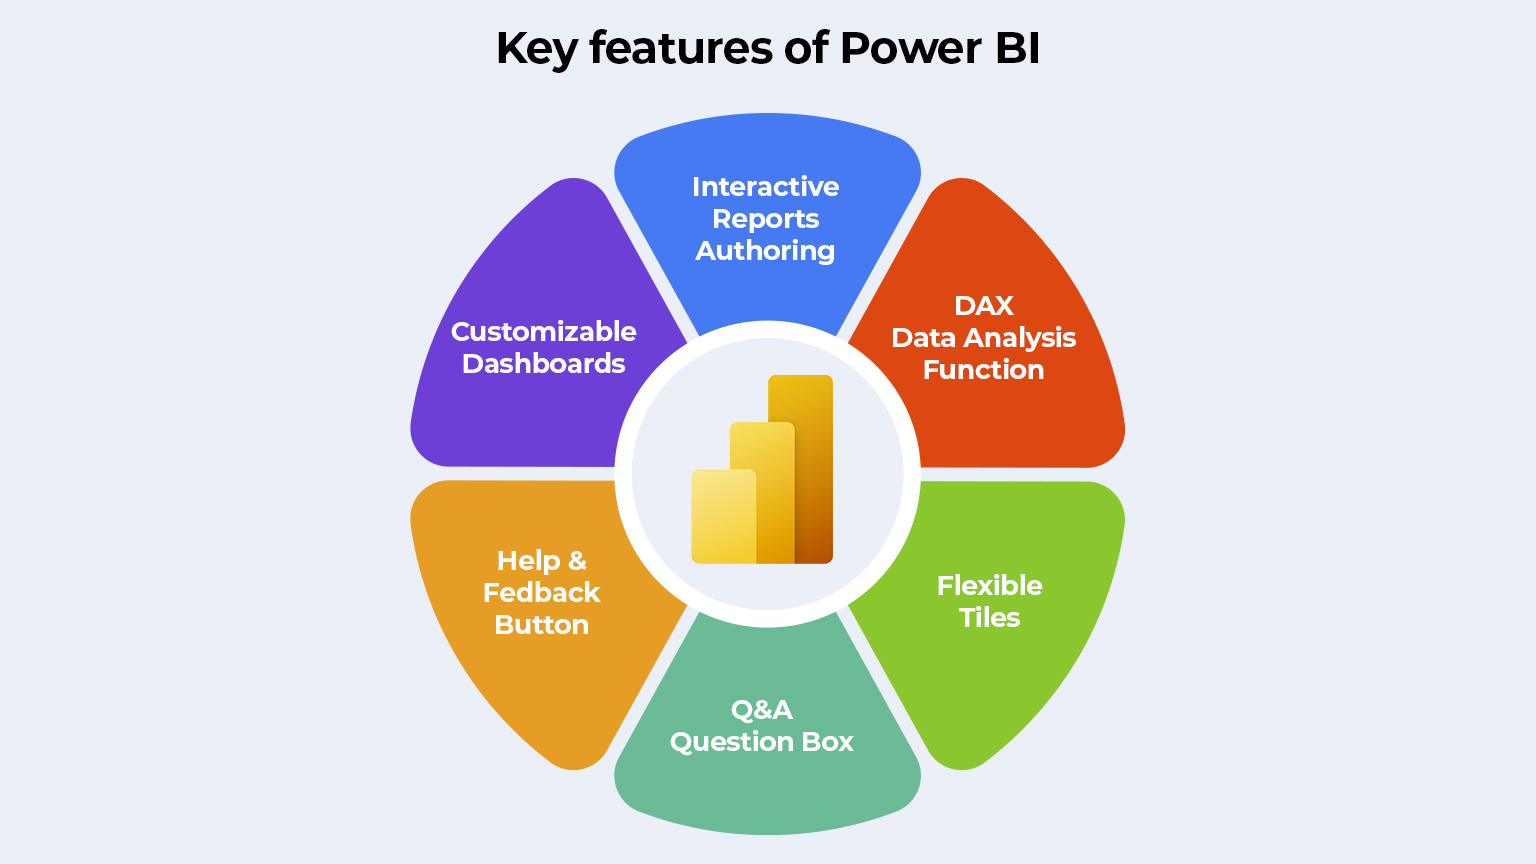
Features of Power BI
Data Visualization
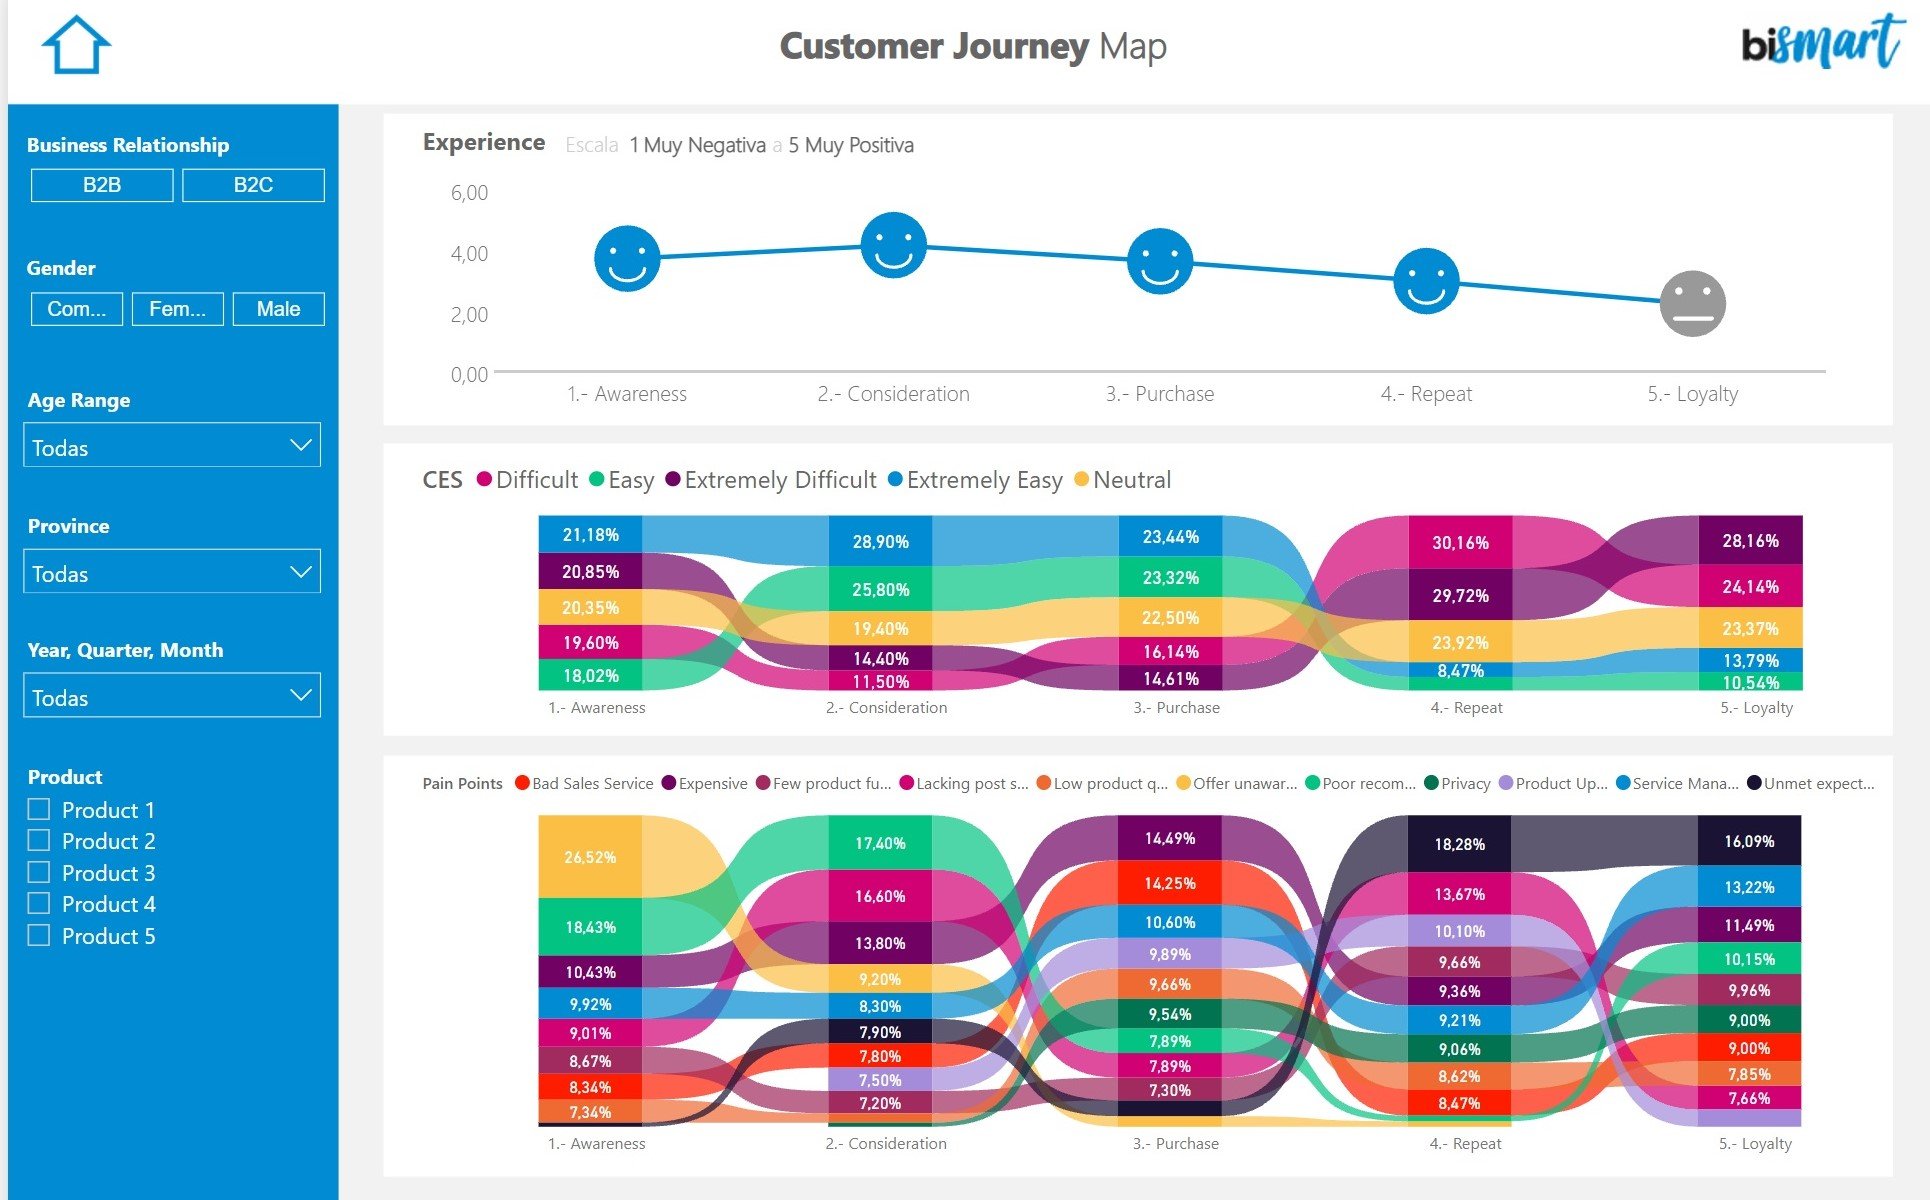
One of Power BI’s standout features is its data visualization capabilities. Users can create stunning visuals such as charts, graphs, and maps to turn complex datasets into intuitive graphics. For example, after transforming sales data into visual formats, a marketing team can quickly identify which campaigns drove the most engagement.
Data Analysis
Data analysis in Power BI allows users to dive deep into their data effortlessly. With built-in analytics tools, users can:
- Apply filters: Focus on specific data segments.
- Perform calculations: Use DAX (Data Analysis Expressions) for custom metrics.
This means anyone, from analysts to executives, can uncover insights without needing advanced technical skills.
Interactive Reports and Dashboards
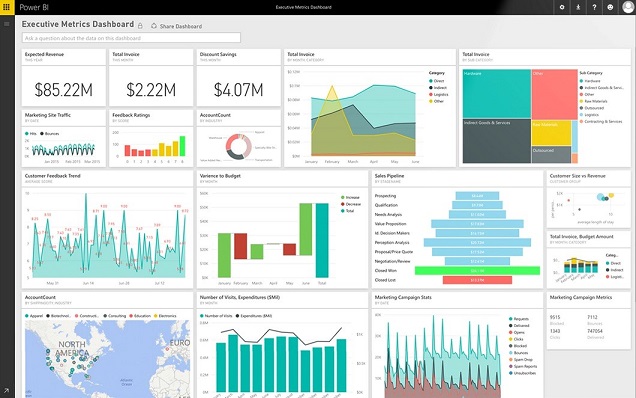
Power BI excels in creating interactive reports and dashboards that engage users. Imagine a dashboard where you can click on a sales trend to see underlying data instantly! Features include:
- Drill-through capabilities: Explore related data instantly.
- Real-time updates: Make decisions based on the latest information.
These features empower teams to present insights dynamically, driving more informed business decisions.
Power BI Components
Power Query
Continuing our deep dive into Power BI, we encounter Power Query, a vital tool for data preparation. It allows users to connect to various data sources and transform them seamlessly. Perhaps you’ve faced messy data formats—Power Query simplifies cleaning and shaping it into a usable format, saving hours of manual sorting.
Power Pivot
Next is Power Pivot, which enhances data modeling capabilities within Power BI. It supports creating relationships between various data tables and enables high-performance data analysis. Users can leverage DAX to create custom calculations and metrics that can instantly illuminate trends. This is crucial for any organization looking to gain deeper insights.
Power View
Power View provides a canvas for creating interactive and visually rich data presentations. It helps users design engaging reports that make insights accessible to all stakeholders. Imagine presenting sales data to executives with dynamic visuals that convey your message clearly. That’s the power of Power View.
Power Map
Lastly, we have Power Map, which adds geospatial analytics to the mix. Users can visualize data on geographical maps, making it perfect for location-based analysis. For example, a retail company can track sales performance by region, easily identifying hotspots and areas requiring attention. Each of these components plays a vital role in enhancing the overall Power BI experience, ensuring users can extract maximum value from their data.
Power BI Integrations
Integration with Excel
Building on the robust capabilities of Power BI, its integration with Excel is a game-changer for data analysts. Many businesses rely on Excel for initial data collections, and Power BI makes it seamless to import and analyze this data further. For instance, you can easily refresh your reports with updated Excel data without starting from scratch.
This integration allows you to:
- Utilize existing Excel formulas and functions.
- Create visualizations directly from familiar spreadsheets.
- Share insights effortlessly across different platforms.
Integration with Azure
Next, let’s discuss Power BI’s integration with Azure, which brings cloud capabilities to the table. By connecting to Azure services, users can tap into vast datasets stored in the cloud and utilize machine learning models for predictive analytics. Imagine running complex data queries without worrying about local storage constraints!
Key benefits of Azure integration include:
- Real-time data updates: Access the latest information instantly.
- Scalability: Easily handle large datasets as your business grows.
- Enhanced security: Safeguard your data with Azure’s robust compliance features.
Together, these integrations ensure that Power BI serves as a comprehensive tool for all your business analytics needs, making data-driven decision-making smoother and more efficient.
Power BI Pricing and Plans
Power BI Desktop
As we delve deeper into Power BI, understanding its pricing and plans is crucial for making informed decisions. Starting with Power BI Desktop, it’s a free application that allows individual users to create reports and dashboards. This option is perfect for solo analysts or small businesses just getting started. Imagine having a robust analytics tool available at no cost—ideal for testing the waters!
Power BI Pro
Next, let’s look at Power BI Pro, which is designed for collaborative use. Priced at a monthly subscription, it enables users to share reports and dashboards securely across organizations. This plan is suitable for teams that require real-time collaboration and access to advanced features. Key perks of Power BI Pro include:
- Collaborative sharing: Easily share insights with teammates.
- Data refreshes: Automated refreshes for up-to-date information.
- Increased storage: More space for data management.
Power BI Premium
Finally, we have Power BI Premium. This enterprise-level service is tailored for organizations needing enhanced capabilities, including larger datasets and higher performance. Essentially, it offers dedicated cloud resources, ensuring faster data processing and sharing options. Premium features include:
- Paginated reports: For detailed reporting needs.
- Advanced AI integration: Help in making more informed decisions.
- On-premises reporting: Ideal for businesses concerned about data security.
By evaluating these plans, organizations can choose the ideal Power BI solution to meet their unique analytics needs, fostering a data-driven environment.
Getting Started with Power BI
Sign Up and Installation
Now that you understand the different pricing options, getting started with Power BI is a straightforward process. To begin, simply sign up for Power BI Desktop by visiting the official website. The installation is user-friendly, taking just a few clicks to set up. Once installed, you’ll be greeted with a clean interface, with plenty of tutorials to help you navigate.
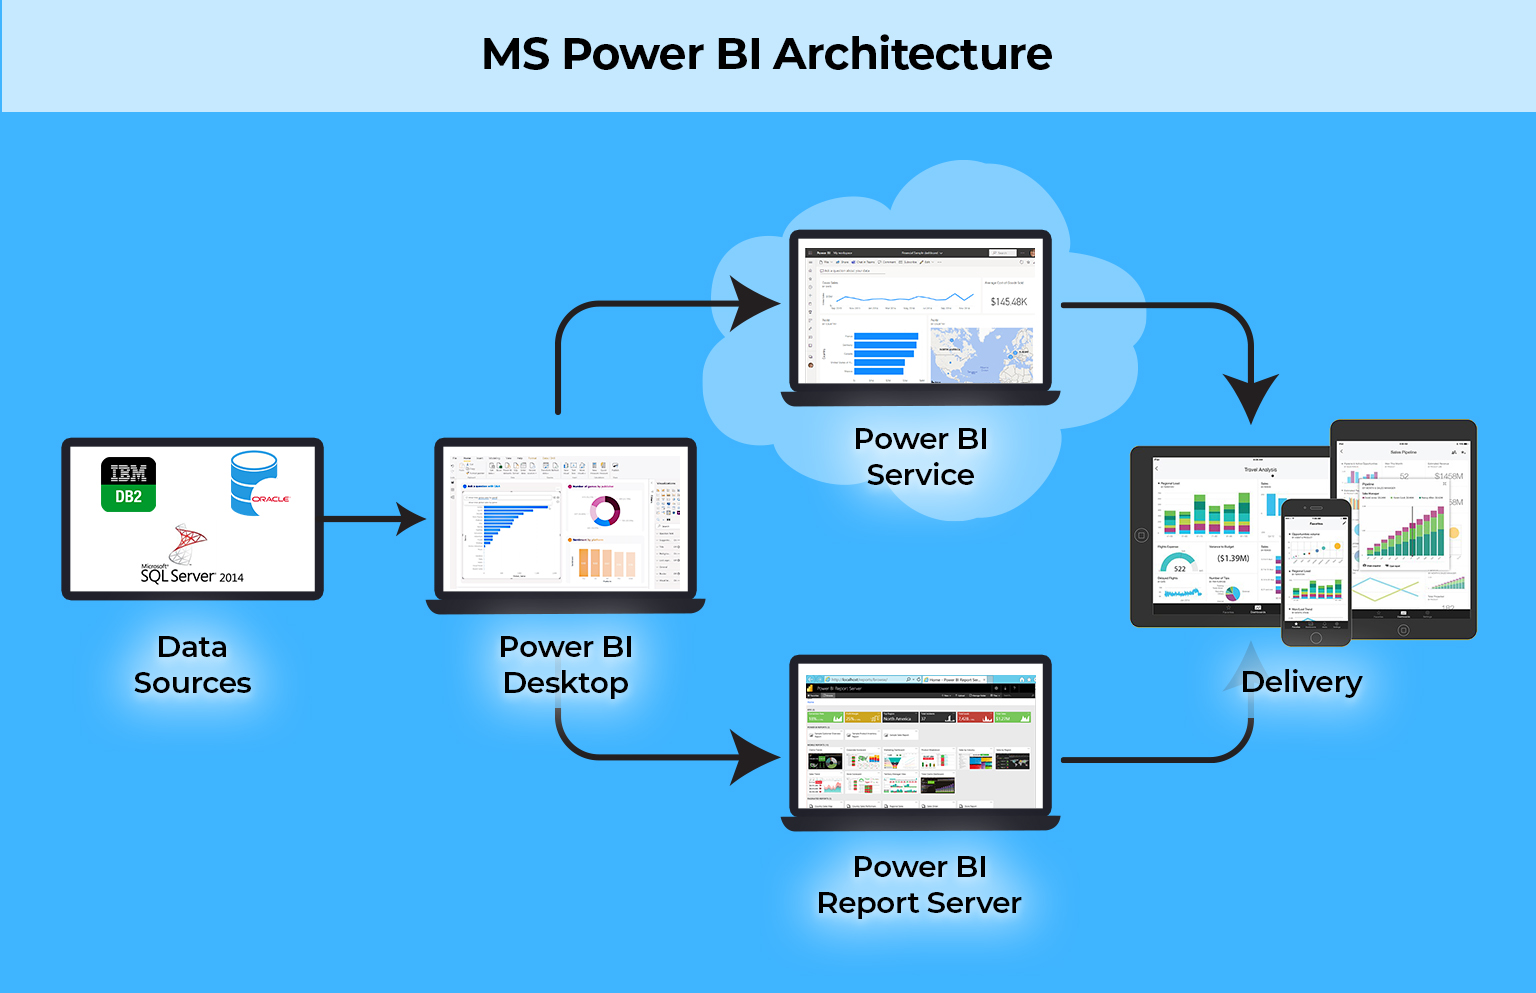
Connecting Data Sources
Next, it’s time to connect your data sources. Power BI supports a wide variety of connectors, including Excel spreadsheets, SQL databases, and cloud-based services like Azure. For example, if you have sales data in Excel, simply select the ‘Get Data’ option, choose Excel, and upload your file. This flexibility makes it easier to integrate existing data without any hassle.
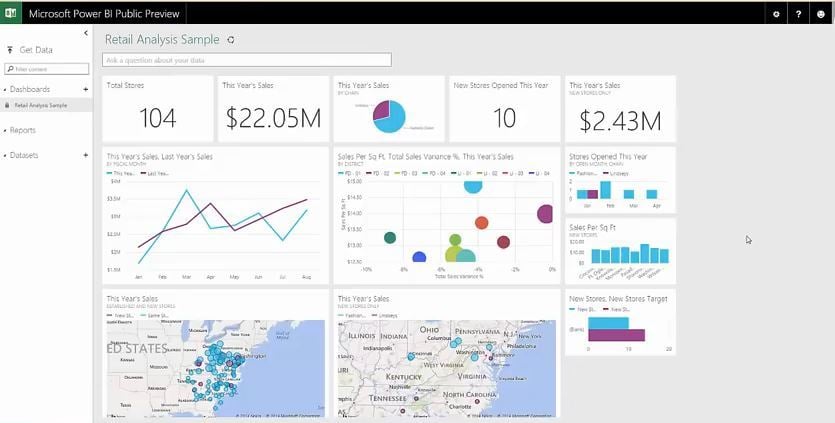
Creating Reports and Dashboards
Finally, with your data in place, you can start creating reports and dashboards—it’s where the fun begins! Power BI offers a drag-and-drop interface that allows you to visualize your data with charts, graphs, and maps effortlessly. For instance, if you’re tracking your sales performance, a simple bar chart can reveal trends in just seconds. Don’t forget to save and publish your reports so that your team can access them in real-time! By following these steps, you’ll quickly harness the power of business analytics to drive informed decisions and insights.
Advanced Power BI Techniques
DAX Queries
Now that you’re comfortable building reports, let’s explore some advanced Power BI techniques to elevate your analytics game. Starting with DAX Queries (Data Analysis Expressions), this powerful formula language allows you to create custom calculations and aggregations. For example, you could write a DAX query to calculate year-over-year sales growth, allowing your team to analyze trends over time.
Some useful DAX functions include:
- SUMX: For calculating sums over a table.
- CALCULATE: To modify filter context.
- IF: For conditional logic in your calculations.
Advanced Data Modeling
Next, let’s delve into Advanced Data Modeling. Organizing your data effectively is crucial for analytics. With relationships and hierarchies, you can create a more intuitive data model. Consider creating a sales model that connects customer, product, and transaction data—this can help in building dynamic dashboards that offer insights across multiple dimensions.
Key tips for effective data modeling:
- Use relationships wisely: Only connect tables that need to interact.
- Create calculated columns: For derived metrics directly in your model.
- Optimize your data: Ensure that your data types are appropriate for better performance.
Custom Visualizations
Lastly, let’s discuss Custom Visualizations. While Power BI comes with a variety of built-in visuals, you can also explore custom visuals tailored to your needs. For example, if you’re analyzing geographical data, a map visualization might be more insightful than standard charts. Platforms like the Microsoft AppSource offer many free and paid visualization options to enhance your reports. By incorporating these advanced techniques, you will transform your Power BI projects into powerful decision-making tools that captivate stakeholders and drive informed strategies.
Power BI Security and Compliance
Data Encryption
As organizations increasingly rely on data for decision-making, the importance of Power BI Security and Compliance cannot be overstated. First up is Data Encryption, which ensures that your sensitive data remains protected both at rest and in transit. Power BI adheres to industry-standard encryption protocols, meaning your data is safe from unauthorized access. For instance, as data travels from your source to the Power BI service, it remains encrypted, safeguarding it during transmission.
Access Control
Next, let’s discuss Access Control. Power BI offers granular access settings that allow administrators to define who can view or edit reports. For example, you can set permissions based on user roles: executives might have full access, while regular users can only view specific dashboards. This flexibility is crucial in large organizations with various teams needing different data insights.
Key features of access control include:
- Row-Level Security (RLS): Restricting data access at the row level.
- Workspace Access: Managing user roles within workspaces effectively.
Compliance Features
Lastly, let’s not overlook Compliance Features. Power BI complies with major standards, such as GDPR and HIPAA, ensuring your organization meets regulatory requirements. These features give businesses peace of mind, knowing they are using a tool that protects data privacy.
In summary, with robust encryption, meticulous access controls, and comprehensive compliance features, Power BI empowers organizations to harness their data securely and confidently, making it a leading choice for business analytics.
Power BI Use Cases
Sales and Marketing Analysis
With a solid foundation in security and compliance, it’s time to explore the practical side of Power BI through various Use Cases. First on the list is Sales and Marketing Analysis. Organizations often leverage Power BI to visualize sales trends and track the effectiveness of marketing campaigns. For example, a company can combine data from CRM systems and social media platforms to determine which channels yield the highest conversion rates.
Key benefits include:
- Real-time performance tracking: Instant insights into sales progress.
- Customer segmentation: Tailoring campaigns based on buyer behavior.
Financial Reporting
Next, let’s look into Financial Reporting. Power BI facilitates the generation of comprehensive financial reports that can be easily shared and visualized. For instance, a finance team can create interactive dashboards showing revenue, expenses, and profit margins, enabling faster decision-making. Users can drill down into specific categories, revealing insights that might be overlooked in traditional spreadsheets.
Benefits of using Power BI for financial reporting:
- Automated data refreshes: Always have the most current figures.
- Enhanced visualizations: Making complex financial data more digestible.
Operational Analytics
Lastly, Operational Analytics focuses on monitoring and optimizing business operations. Businesses can use Power BI to track key performance indicators (KPIs) across departments, ensuring alignment with strategic goals. For example, a manufacturer can analyze production metrics, inventory levels, and supply chain efficiency all in one place, leading to improved operational agility.
With these diverse use cases, Power BI proves to be an invaluable tool for businesses seeking to enhance their analytics capabilities and drive informed decision-making across various functions.
Future Trends in Power BI
AI and Machine Learning Integration
As organizations continue to leverage Power BI for data-driven decision-making, the future trends indicate exciting advancements. One noteworthy trend is the integration of AI and Machine Learning within Power BI. This capability allows users to harness predictive analytics, enabling them to forecast future trends based on historical data. For example, a retail company could utilize machine learning algorithms to predict inventory needs, minimizing overstock or stockouts.
Key features of AI integration include:
- Natural Language Processing (NLP): Users can query data using everyday language.
- Automated Insights: AI-driven suggestions for data interpretation enhance user experience.
Augmented Analytics
Another emerging trend is Augmented Analytics, which further democratizes data analysis by automating insights. This trend empowers users with minimal technical knowledge to uncover valuable insights through intuitive tools. Imagine a marketing manager receiving automated recommendations on optimizing campaigns based on recent performance data, all without needing a data team.
Benefits of Augmented Analytics include:
- Enhanced decision-making speed: Real-time insights lead to faster actions.
- User-friendliness: Simplified data exploration fosters broader adoption.
By embracing these trends, Power BI is poised to transform how organizations approach data, making it more accessible and actionable for everyone, regardless of their technical expertise.
Conclusion
Benefits of Using Power BI
In wrapping up our exploration of Power BI, it’s important to highlight the benefits of using this powerful tool. From enhancing data visualization to enabling seamless collaboration, Power BI equips organizations with the insights necessary for informed decision-making. Users appreciate the ability to connect diverse data sources and create interactive dashboards that tell compelling stories. Key advantages include:
- Real-time data access: Make decisions based on the latest information.
- Cost-effective plans: Options for businesses of all sizes.
Final Thoughts
Ultimately, adopting Power BI is not just about utilizing software—it’s about fostering a culture of data-driven decision-making within an organization. With continuous advancements in AI and analytics, Power BI is set to remain at the forefront of business intelligence, making it a wise investment for any organization looking to thrive in today’s competitive environment. Embracing Power BI is truly embarking on a journey to unlock the full potential of your data, and there has never been a better time to start!
