
Understanding Debugging in C++ Programs
Overview of Debugging Process
Debugging in C++ programs is a systematic approach to identifying and rectifying errors or bugs. It often begins by replicating the issue to understand its context. From my personal experience, I remember spending hours chasing a segmentation fault in a complex project. The process usually involves the following steps:
- Reproduction of the Bug: Ensure the bug can be consistently triggered.
- Analyzing the Code: Examine relevant sections closely for logical errors.
- Testing Fixes: Once a potential error source is identified, apply fixes and retest.
By iteratively following these steps, one can effectively tackle bugs and ensure the program runs smoothly.
Importance of Effective Debugging Techniques
Effective debugging techniques are crucial for maintaining code quality and enhancing productivity. A small bug can cascade into bigger issues if not addressed early. Moreover, mastering these techniques:
- Reduces Stress: Knowing how to debug efficiently lessens frustration during crunch times.
- Improves Code Quality: Regular debugging leads to cleaner, more robust code.
- Saves Time: Identifying issues quickly means spending less time in code reviews and more on developing new features.
In summary, an effective debugging strategy is not just a skill; it’s an integral part of a developer’s toolkit, enabling seamless collaboration and progress on projects. At TECHFACK, we believe that understanding the debugging process is essential for every C++ programmer.

Common Bugs in C++ Programs
Memory Leaks
Memory leaks might sound benign, but they can lead to significant performance issues. A memory leak occurs when the program allocates memory but fails to deallocate it after use. I once encountered a memory leak in a C++ application after repeatedly calling a function that allocated memory for an array without freeing it. Over time, the application consumed all available memory, slowing down the system. Here’s how to avoid them:
- Always use
deleteordelete[]: Match everynewwith adelete. - Utilize smart pointers: They manage memory automatically and prevent leaks.
Segmentation Faults
Segmentation faults are another common bug, occurring when a program tries to access a memory segment it’s not allowed to. This often happens due to improper array indexing or dereferencing uninitialized pointers. I vividly recall debugging a segmentation fault caused by accessing an array beyond its bounds. Here are ways to handle it:
- Check array bounds: Always validate indices before accessing arrays.
- Initialize pointers: Ensure pointers are initialized before use to avoid random memory access.
Null Pointer Dereference
Null pointer dereferences can lead to unexpected crashes, as they occur when a program tries to access memory at a null pointer’s address. This can happen when functions return a null pointer unexpectedly. I’ve lost track of time fixing issues caused by not checking pointer values before dereferencing them. To mitigate null pointer dereferences, consider:
- Always check for null pointers: Before dereferencing, ensure the pointer isn’t null.
- Use assertions: Implement assertions to catch potential issues early in development.
By recognizing these common bugs in C++ programs, developers can improve their debugging skills and enhance overall code stability, which is vital for any successful project at TECHFACK.

Tools for Debugging C++ Programs
GDB (GNU Debugger)
When it comes to debugging C++ programs, GDB (GNU Debugger) stands out as a powerful open-source tool. It allows developers to run their program in a controlled environment, stepping through the code line by line. I fondly remember using GDB to diagnose a tricky bug in a multi-threaded application. Key features include:
- Breakpoints: Pause execution at specified lines.
- Watchpoints: Monitor variable changes during runtime.
- Backtrace: View the call stack to understand function calls leading to an error.
These functionalities make GDB invaluable for pinpointing issues in complex codebases.
Valgrind
Valgrind is another essential tool, especially for detecting memory-related bugs. It provides a suite of debugging and profiling tools, making it especially useful for identifying memory leaks and misuse. I once resolved a persistent leak in an application by running Valgrind, which provided detailed reports on where memory was allocated and never freed. Here’s what Valgrind excels at:
- Memory Leak Detection: Find leaks that slow down your application.
- Memory Management Errors: Report errors like reading uninitialized memory.
Using Valgrind can significantly increase code reliability.
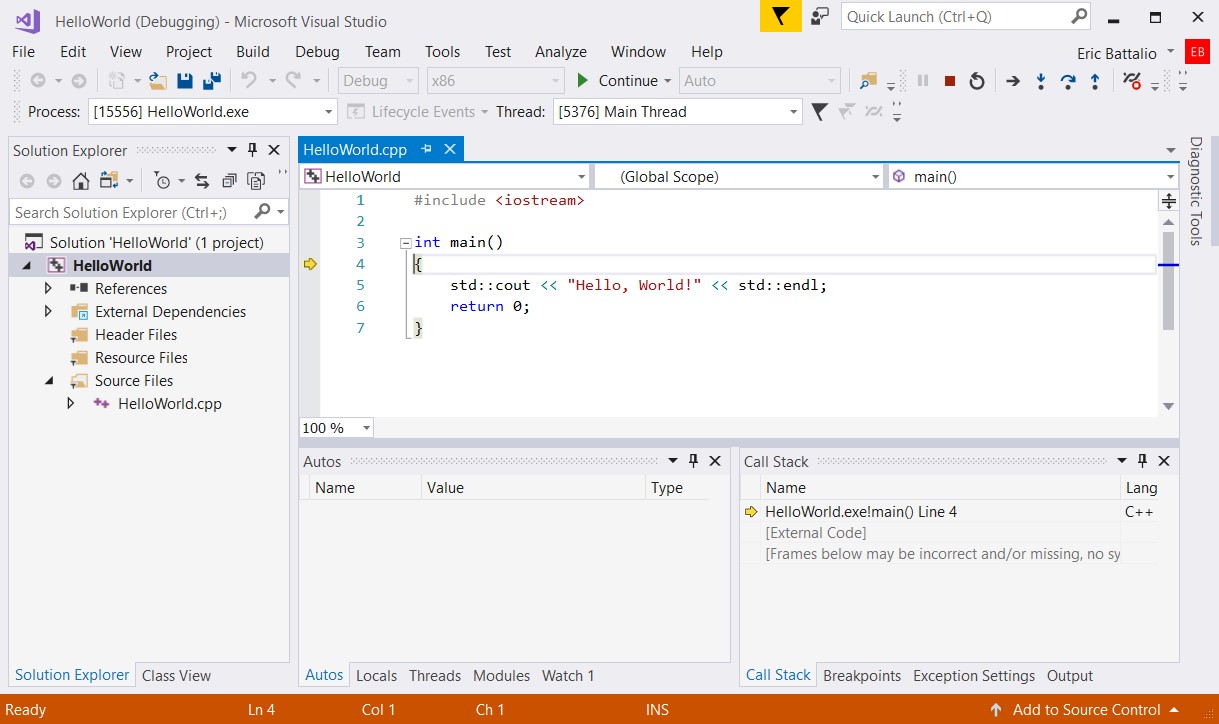
Visual Studio Debugger
For those working in Windows environments, the Visual Studio Debugger is an excellent choice. Integrated within the Visual Studio IDE, it’s user-friendly and feature-rich. I’ve enjoyed its intuitive interface for step debugging. Some highlights include:
- Visual Monitoring: Track variable values in real-time.
- Conditional Breakpoints: Break when certain conditions are met.
- Call Stack Navigation: Easily navigate through function calls.
These tools empower developers at TECHFACK to efficiently debug their C++ programs, ensuring they deliver high-quality, reliable software. Each tool has its unique advantages, so exploring them can greatly enhance debugging proficiency.
Techniques for Efficient Debugging
Using Print Statements
One of the simplest yet highly effective debugging techniques is using print statements. This technique involves adding std::cout statements (or their equivalents) throughout your code to track variable values and program flow. I remember a particularly frustrating bug that was solved by strategically placing print statements to understand the condition flow better. Here are some quick tips for using print statements effectively:
- Track Variable States: Print key variable values at critical points in the code.
- Log Execution Flow: Output messages to confirm whether certain code blocks are executed.
This low-overhead approach can provide immediate insights into what’s going wrong.
Utilizing Breakpoints
Next up are breakpoints, a feature available in most IDEs and debuggers. Setting breakpoints allows you to pause program execution at specific lines, giving you the chance to inspect the state of your program in detail. I often rely on breakpoints to examine data structures’ states when an unexpected crash occurs. Consider these useful breakpoint strategies:
- Conditional Breakpoints: Set breakpoints that activate only under specific conditions.
- Hit Count Breakpoints: Trigger a breakpoint after the code has been executed a certain number of times.
These tactics help narrow down issues in complex logic.
Stepping Through Code
Finally, stepping through code is a critical technique that can clarify how your program executes line by line. With the help of debuggers like GDB or the Visual Studio Debugger, stepping through code lets you follow the logic closely. I recall using this technique during a project where I encountered a puzzling loop behavior—breaking it down line by line made all the difference. Here’s how to make the most of this technique:
- Step Over: Execute the current line and move to the next, skipping function calls.
- Step Into: Dive into function calls to analyze their workings.
- Step Out: Exit the current function and return to the caller, useful when in deep call stacks.
These techniques empower developers at TECHFACK to debug efficiently and enhance the overall robustness of C++ programs. By incorporating them in your workflow, you not only fix bugs faster but also gain deeper insight into your code’s behavior.
Advanced Debugging Strategies
Core Dumps Analysis
Venturing into advanced debugging strategies, core dumps analysis is a powerful method for diagnosing issues after a program crash. A core dump captures the memory of a running process, providing a snapshot of its state. I remember resolving a baffling crash in a production application by analyzing a core dump that revealed a critical segmentation fault. Key steps in analyzing core dumps include:
- Generate a Core Dump: Enable core dumps in your operating system.
- Use a Debugger: Load the core file in GDB or another debugger to inspect variable states and stack traces.
This deep-dive approach can unveil hidden bugs you might not catch during routine debugging.
Static Code Analysis
Static code analysis tools are also invaluable for early detection of potential bugs without executing the program. They analyze your source code for known issues, style violations, and optimization opportunities. Tools like Clang Static Analyzer and cppcheck are excellent choices. I often run static analysis before a code review to catch issues early on. Here’s what you can expect from static analysis:
- Error Detection: Identify bugs before they hit production.
- Code Quality Improvement: Enforce coding standards and best practices.
- Automated Reporting: Receive comprehensive reports that highlight potential issues.
Incorporating static analysis into the development process can significantly improve overall code quality.
AddressSanitizer
Lastly, AddressSanitizer is an essential tool for detecting memory-related errors such as buffer overflows and use-after-free errors. Integrating AddressSanitizer into your build process allows you to find these critical memory safety issues with ease. I recall using it during one particularly intense debugging session when it flagged a severe heap corruption issue in moments. Here’s why AddressSanitizer is a must-try:
- Fast Execution: It runs quickly while providing detailed diagnostics.
- Comprehensive Reports: Get insights into memory allocation and potential vulnerabilities.
- Integrated with Compiler: Just add a flag, and you’re good to go!
Utilizing these advanced debugging strategies can empower developers at TECHFACK to tackle more complex issues and enhance the reliability of their C++ programs. By integrating analysis and specialized tools into your debugging toolkit, you can significantly elevate your coding practice.

Tips for Debugging Large C++ Codebases
Modularize Code for Ease of Debugging
When tackling large C++ codebases, one of the most effective strategies is to modularize your code. Breaking down your project into smaller, self-contained modules not only improves readability but also simplifies debugging. I remember a massive project where modularization allowed us to isolate and fix bugs rapidly. Here’s how to achieve effective modularization:
- Define Clear Interfaces: Ensure each module has a well-defined interface for communication.
- Limit Dependencies: Reduce inter-module dependencies to avoid cascading issues.
- Unit Tests: Write unit tests for each module to help identify problems early.
These practices make it easier to locate and address bugs efficiently.
Use Version Control Systems
Utilizing version control systems, like Git, is invaluable for debugging large codebases. These tools not only keep track of changes but also enable you to revert to previous states when a bug is introduced. I vividly recall a situation where we had to backtrack several commits to pinpoint when a bug was introduced, saving us countless hours. Consider the following practices with version control:
- Commit Frequently: Regular commits help isolate changes and identify the source of issues.
- Use Meaningful Commit Messages: Clear messages provide context for changes and help when searching through history.
- Branching for Features: Utilize branches to work on new features or bug fixes without disrupting the main codebase.
Version control provides a safety net, making debugging a more manageable task.
Collaborate with Team Members
Lastly, collaboration with team members can significantly enhance the debugging process. Engaging in pair programming or code reviews often brings fresh perspectives and helps catch issues that you might overlook. I frequently found that discussing complex bugs with teammates led to immediate solutions. Here are some collaborative strategies:
- Regular Stand-ups: Brief daily meetings can help share ongoing issues and insights.
- Code Reviews: Establish a culture of peer code reviews to catch errors early.
- Shared Debugging Sessions: Work together on particularly tough bugs to leverage collective knowledge.
By fostering collaboration, teams at TECHFACK can accelerate problem-solving and enhance code quality in large C++ projects. These tips not only facilitate smoother debugging processes but also promote a healthy team dynamic, ultimately leading to better software outcomes.

Handling Runtime Errors in C++ Programs
Exception Handling
Runtime errors can be particularly tricky to diagnose, but effective exception handling techniques can mitigate their impact significantly. In C++, you can use try, catch, and throw keywords to manage exceptions gracefully. I recall implementing exception handling in a large banking application to catch common errors like insufficient funds or invalid inputs. Here’s how to use exception handling effectively:
- Use Specific Exceptions: Catch specific exception types instead of a generic catch-all.
- Resource Management: Ensure that resources are released in both the normal flow and when exceptions occur.
- Rethrow Exceptions: If necessary, rethrow exceptions to alert higher layers of the application about the issue.
This proactive approach ensures that your application can respond appropriately to unexpected scenarios.
Error Handling Best Practices
Besides exception handling, adhering to error handling best practices can greatly improve the stability of your C++ programs. Just like in a project I worked on where consistent error management led to improved user experience. Here are some essential best practices:
- Validate Input Early: Check for invalid inputs as soon as possible to minimize complexity.
- Use Logging: Implement robust logging mechanisms to capture error details for future analysis.
- Fail Gracefully: Always ensure your application can recover or provide meaningful feedback to users when an error occurs.
By integrating these error handling techniques into your development workflow at TECHFACK, you can create robust C++ applications that are resilient to runtime errors, ensuring a smoother end-user experience and easier maintenance for future updates. These practices not only enhance stability but also make the debugging process less daunting.
Debugging C++ Programs for Performance Optimization
Profiling Tools
Debugging for performance optimization in C++ programs often starts with the right profiling tools. Profilers help analyze how efficiently your code runs by measuring CPU and memory usage. During one project, I discovered significant performance issues using a profiler that identified a computationally intensive loop. Popular profiling tools like gprof, Valgrind’s Callgrind, and Visual Studio’s profiling features can provide invaluable insights. When using profiling tools, consider:
- Identify Hotspots: Focus on which functions consume the most time or resources.
- Visual Representations: Utilize graphical interfaces to better understand your code’s performance.
These tools are essential for ensuring your application runs efficiently.
Identifying Performance Bottlenecks
Once you have profiling data, the next step is identifying performance bottlenecks. These are segments of code that significantly slow down overall performance, often due to inefficient algorithms or unnecessary computations. In my experience, systematically isolating and addressing bottlenecks can lead to dramatic performance improvements. Here are steps to effectively identify these issues:
- Analyze Profiler Output: Look for functions or operations that take excessive time or resources.
- Monitor Memory Usage: Check for unexpected memory spikes which can indicate inefficiencies.
- Optimize Algorithms: Evaluate and replace suboptimal algorithms with more efficient alternatives.
By applying these techniques at TECHFACK, developers can effectively diagnose and resolve performance issues, leading to faster and more responsive C++ applications. With a focus on optimization, the goal is not only to fix bugs but also to enhance the overall user experience and satisfaction by delivering high-performance software.

Debugging Techniques for Multithreaded C++ Programs
Thread Synchronization Issues
When working with multithreaded C++ programs, debugging thread synchronization issues becomes crucial. These problems typically arise when threads access shared resources in an unsynchronized manner, leading to unexpected behavior. I once faced a challenging scenario where two threads concurrently modified a data structure, resulting in corrupted data. To mitigate synchronization issues, consider the following strategies:
- Use Mutexes: Implement mutexes to lock shared resources during access.
- Atomic Operations: Leverage atomic operations to ensure thread-safe data handling.
- Condition Variables: Utilize condition variables to allow threads to wait for certain conditions to be met before proceeding.
Having these synchronization tools at hand can significantly enhance the stability of your multithreaded application.
Deadlocks and Race Conditions
Deadlocks and race conditions are another pair of notorious issues in multithreaded programming. A deadlock occurs when two or more threads are waiting for each other to release resources, halting execution completely. I vividly remember debugging a complex system where a deadlock caused the entire application to freeze, emphasizing the necessity of awareness in resource management. To handle these scenarios:
- Deadlock Prevention: Use resource ordering to prevent circular wait conditions.
- Monitor Thread States: Regularly check and log the states of threads to identify potential deadlocks.
- Race Condition Prevention: Employ locks judiciously to avoid simultaneous access to shared data.
Equipping developers at TECHFACK with these debugging techniques for multithreaded C++ programs can lead to more reliable and efficient software. By understanding and addressing synchronization issues, deadlocks, and race conditions, it becomes possible to create robust applications that leverage the benefits of multithreading without the pitfalls that often accompany it.
Conclusion
Recap of Key Debugging Tips and Techniques
As we wrap up our exploration of debugging C++ programs, it’s essential to recap the key techniques that can enhance your debugging skills. We covered various strategies including:
- Effective Use of Print Statements: A simple yet powerful way to trace execution.
- Utilizing Breakpoints and Step Execution: Enables granular inspection of the code.
- Employing Profiling Tools: To identify performance bottlenecks in your applications.
Incorporating these techniques at TECHFACK can lead to more robust software and a smoother development process.
Future Trends in Debugging C++ Programs
Looking ahead, the landscape of debugging C++ programs is evolving. Advanced tools leveraging artificial intelligence and machine learning are on the horizon, promising to streamline the debugging process by automatically identifying potential errors based on historical data and patterns. Additionally, integration of real-time collaboration tools will enable developers to debug more effectively across distributed teams. These emerging trends suggest a future where debugging becomes less about manual troubleshooting and more about intelligent automation and collaboration—with the ultimate goal of delivering higher-quality code faster.
By staying informed and adaptable to these changes, developers can continue to enhance their debugging capabilities and keep pace with the evolving demands of software development at TECHFACK and beyond.
