

Overview of Java Memory Management
Introduction to Java Memory Management
Java Memory Management is a critical aspect of Java programming that involves the allocation, usage, and release of memory resources in applications. As developers, we often leverage a managed environment where memory allocation happens automatically. This abstraction allows us to focus more on functionality instead of nitty-gritty memory management tasks. However, it’s essential to understand how this works under the hood for optimal application performance.
When I first started coding in Java, I found it liberating that I didn’t need to worry about manual memory allocations like in C or C++. I could simply create objects, and the Java Virtual Machine (JVM) would handle the rest. This powerful feature is central to the reliability of Java applications.
Importance of Garbage Collection in Java
One of the cornerstones of Java Memory Management is Garbage Collection (GC). It is the process that helps reclaim memory occupied by objects that are no longer in use, ensuring efficient memory utilization. Here’s why GC is so important:
- Automatic Cleanup: It reduces the risk of memory leaks, allowing developers to avoid superfluous memory usage.
- Performance Efficiency: Properly set GC can lead to faster application performance by optimizing memory allocation.
- Improved Stability: By cleaning up unused objects, it minimizes the risk of application crashes and promotes stable runtime environments.
Understanding Java Memory Management, especially the notion of Garbage Collection, is fundamental for any developer looking to build robust applications on the Java platform.

Memory Allocation in Java
Stack vs Heap Memory
Diving deeper into Java Memory Management, it’s essential to distinguish between Stack and Heap memory—two crucial regions where Java allocates memory.
- Stack Memory:
- Used for static memory allocation.
- Stores primitive types and object references.
- Each thread has its own stack, making it lightweight.
- Objects are automatically removed when they go out of scope, ensuring quick access and efficient usage.
While developing a multiplayer gaming application, I noticed how the stack allows for faster memory access during real-time gameplay. The temporary variables representing player states could quickly be created and disposed of without overhead.
- Heap Memory:
- Used for dynamic memory allocation.
- Stores objects and their instance variables.
- Managed by the JVM’s Garbage Collector, leading to more overhead than stack allocation.
- The scope of memory allocation persists until the object is no longer referenced.
Understanding the distinction allowed me to optimize certain code segments, keeping frequently accessed data in the stack, which minimized latency.
Java Memory Model
The Java Memory Model (JMM) provides a framework to understand how Java threads interact through memory. It defines rules for visibility and ordering of variables, ensuring that when one thread modifies a shared variable, others can see the update promptly.
A solid grasp of the JMM is essential, particularly in multi-threaded applications, to avoid issues like race conditions and ensure data consistency across threads. By adhering to the principles laid out in the JMM, developers can write safe and efficient concurrent Java applications.

Understanding Garbage Collection
How Garbage Collection Works
Continuing our exploration of Java Memory Management, a critical concept we must delve into is Garbage Collection (GC). So, how does GC actually work? In a nutshell, it automatically identifies and removes objects that are no longer referenced by the application.
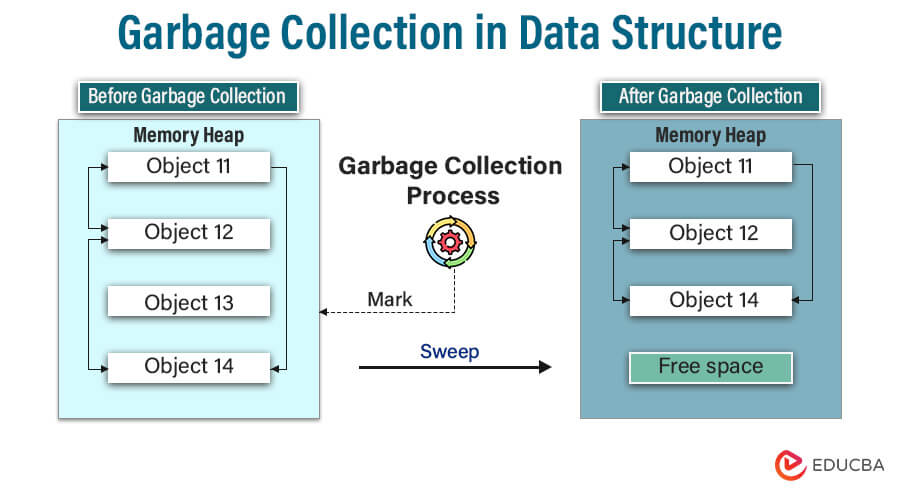
The process can be broken down into a few key steps:
- Marking: The GC identifies which objects in the heap are still in use; these are marked accordingly.
- Sweeping: The unmarked objects, no longer referenced, are cleared from memory to free up space.
- Compacting: This optional step can rearrange the remaining objects in memory to eliminate fragmentation, ensuring that free memory is contiguous.
Each time I watched my application sluggishly respond—as memory consumed by unused objects saturated the heap—I wished I had tuned the garbage collector more for smoother operation.
Generational Garbage Collection
A fascinating approach within GC is Generational Garbage Collection. This technique divides objects into different generations based on their lifespan:
- Young Generation: Where new objects are allocated; most objects die young, leading to frequent collections.
- Old Generation: Where long-lived objects live after surviving a few cycles in the young generation.
- Permanent Generation: Used for storing metadata about classes and methods.
Using this strategy enables the JVM to optimize performance considerably. Since most objects become unreachable quickly, focusing on the young generation reduces overhead during garbage collection. This innovative system enhances efficiency, making GC not just a mechanic, but a sophisticated process that significantly impacts application performance. Understanding this depth of Garbage Collection can empower developers to write more efficient and responsive Java applications.
Types of Garbage Collectors in Java
Serial Garbage Collector
One of the simplest and most straightforward garbage collectors available in Java is the Serial Garbage Collector. It is particularly suited for single-threaded applications and smaller datasets. Here’s a quick rundown of its characteristics:
- Single-Threaded: Handles all garbage collection tasks in a single thread, which can lead to pauses in application execution.
- Use Cases: Ideal for small applications or those running on resource-constrained environments.
Reflecting on my early days of Java development, I utilized the Serial Garbage Collector for a small desktop application, and it efficiently managed memory without much overhead.
Parallel Garbage Collector
Next up is the Parallel Garbage Collector, also known as the throughput collector. It’s designed for applications that require high throughput and can benefit from utilizing multiple processors.
- Multi-Threaded: It performs minor garbage collection tasks in parallel, significantly reducing pause times.
- Recommended For: Server-side applications that manage larger memory heaps.
The first time I deployed a web application using this collector, I immediately noticed improved performance during peak load times.
CMS Garbage Collector
The Concurrent Mark-Sweep (CMS) Garbage Collector takes things a step further by minimizing pause times significantly.
- Concurrent Phases: It conducts marking and sweeping phases concurrently with application threads.
- Focus on Responsiveness: Perfect for applications where low latency is crucial, such as trading systems or real-time data processing.
Using the CMS collector in my banking application helped maintain responsiveness, even when workload spikes occurred.
G1 Garbage Collector
Finally, we have the G1 (Garbage-First) Garbage Collector. This is designed for applications that require predictable pause times and can manage large heaps effectively.
- Region-Based: It divides the heap into smaller regions, prioritizing the collection of the most frequently collected areas.
- Adaptive: G1 can adapt its collection strategy based on application behavior, optimizing itself over time.
In my latest project, where performance metrics were critical, switching to G1 enabled us to achieve consistent response times across varying loads.
Understanding these different garbage collectors empowers developers to choose the right one based on the application’s specific needs and constraints, ultimately leading to more efficient Java applications.
Monitoring and Tuning Garbage Collection
Tools for Garbage Collection Analysis
After selecting the right garbage collector, the next logical step in refining Java Memory Management is monitoring and tuning GC processes. Various tools can help analyze and visualize garbage collection behavior, ensuring optimal performance of your application. Here are a few notable options:
- Java VisualVM: A powerful tool that provides real-time monitoring of JVM performance, including garbage collection metrics. It allows you to visualize heap dumps, track memory usage, and monitor thread behavior.
- JConsole: A lightweight GUI tool to connect to a JVM, offering insights into heap memory usage, garbage collection activity, and other vital statistics.
- GC Logs: By enabling GC logging options (like
-XX:+PrintGCDetails), you can gather data that allows for an in-depth understanding of how memory is being managed.
In one project, I used Java VisualVM to identify frequent full garbage collections, which helped pinpoint memory leaks I hadn’t noticed before.
Techniques for Garbage Collection Optimization
Once you’ve gathered insights, optimizing your garbage collection might yield significant performance boosts. Here are some techniques:
- Adjust Heap Size: Tuning the Initial (
-Xms) and Maximum (-Xmx) heap size can optimize both performance and memory usage. - Select Appropriate Garbage Collector: Based on your application needs, switching between different collectors can lead to substantial performance improvements.
- Eliminate Unused Objects: Adopt best coding practices to reduce object creation and facilitate timely memory release, minimizing overall garbage collection load.
By employing these techniques, I’ve been able to enhance the application performance significantly, ensuring a smoother user experience. Monitoring garbage collection effectively and implementing strategic optimizations transforms memory management from a potential hurdle into a streamlined aspect of Java development.
Common Garbage Collection Issues and Solutions
Memory Leaks
Despite the benefits of automatic garbage collection, developers often encounter memory leaks, a common issue that can drastically affect application performance. A memory leak occurs when objects remain referenced and thus cannot be garbage-collected, slowly consuming heap memory over time.
- Identification: Tools like VisualVM or Eclipse Memory Analyzer can help identify leaking objects in your application.
- Solutions: To solve these leaks, carefully review your code for unnecessary references, especially in container classes, static fields, or long-lived objects.
I once faced a challenging memory leak in a web application that was retaining unnecessary user session objects. By refactoring the code to clear session data properly, the memory issue was resolved.
Performance Impact
Another critical aspect of GC is its potential performance impact. Inefficient garbage collection can lead to frequent full collections, causing application pause times.
- Symptoms: These issues manifest as sluggish response times, particularly under load.
- Resolution: Tuning the JVM parameters can significantly mitigate performance impacts. Increasing the heap size or optimizing the choice of garbage collector often leads to noticeable performance enhancements.
During a load test for an application, I observed significant pauses, prompting me to switch from the Serial GC to the G1 GC, which dramatically improved the responsiveness.
Best Practices for Memory Management
To circumvent issues related to garbage collection, adhering to best practices is crucial:
- Minimize Object Creation: Use object pooling or reuse objects whenever feasible to decrease GC pressure.
- Release References Explicitly: Set object references to null once they are no longer needed, aiding garbage collection.
- Profile Regularly: Consistently monitor your application’s memory usage to identify and rectify issues before they escalate.
Implementing these best practices not only helps maintain efficient memory management but also fosters a robust programming environment, ultimately leading to enhanced Java application performance.
Conclusion
Recap of Java Memory Management Concepts
As we wrap up our exploration of Java Memory Management, it’s vital to reflect on the key concepts we’ve covered. We began by discussing the essential difference between stack and heap memory, which lays the groundwork for understanding how Java manages memory.
We then ventured into the realm of garbage collection, highlighting its critical functions: identifying unreachable objects and reclaiming memory dynamically. We also examined various garbage collectors, such as the Serial, Parallel, CMS, and G1 collectors, each with its unique strengths tailored for different application requirements.
Personally, I’ve seen how selecting the right garbage collector can lead to remarkable performance improvements. This understanding can mean the difference between a smooth-running application and one plagued by memory issues.
Importance of Efficient Garbage Collection in Java Applications
Efficient garbage collection is not just a technical detail; it’s foundational to building robust Java applications. It helps maintain optimal performance, stability, and resource management, all of which are critical in today’s fast-paced development environments.
By actively monitoring garbage collection processes and implementing best practices, developers can create applications that are not only faster but also more resilient to memory-related issues. Embracing these practices will ultimately lead to more efficient, well-optimized Java applications that meet user demands and exceed expectations. As developers, we should continuously strive for excellence in memory management to enhance the overall performance and reliability of our applications.
