

Introduction
Overview of Python and R
In the landscape of data analysis, two languages stand out prominently: Python and R.
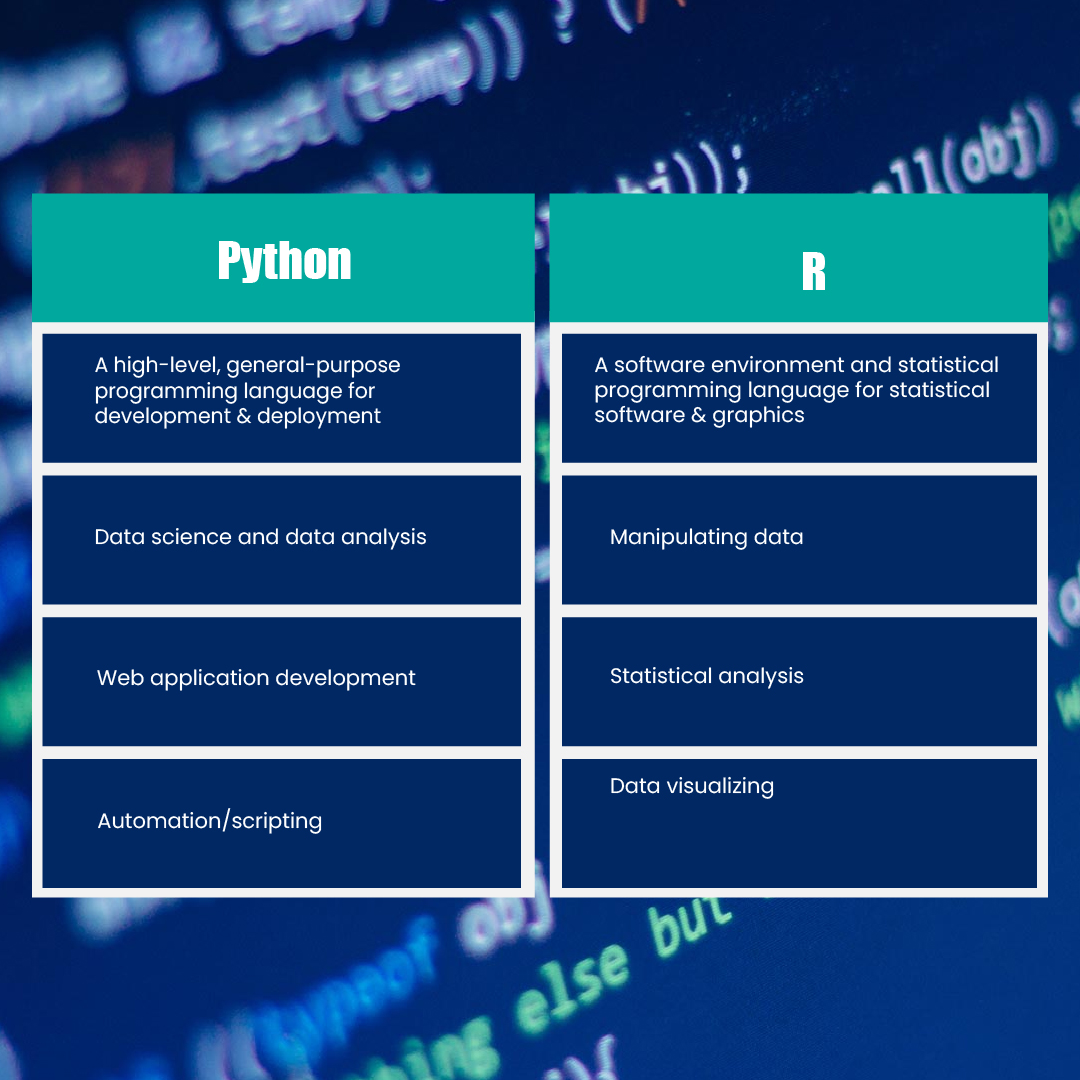
- Python: Widely recognized for its simplicity and versatility, Python has become a favorite among data scientists and analysts. Its general-purpose nature makes it suitable for various applications beyond data analysis, setting it apart as a multifunctional tool.
- R: On the other hand, R is specifically designed for statistical computing and graphics, making it incredibly powerful for data analysis tasks. It boasts a rich repository of packages tailored for statistical methods and visualizations, which catapults it to the forefront for many statisticians.
Both languages have carved out significant niches, but choosing between Python and R often depends on the specific needs of a project.
Importance of Data Analysis in Today’s World
In today’s data-driven world, the significance of data analysis cannot be overstated. Organizations rely on data to make informed decisions, optimize processes, and enhance customer experiences. Some key points include:
- Decision-Making: Data analysis allows companies to glean actionable insights, leading to better strategic choices.
- Performance Improvement: Continuous monitoring and analysis of business operations enable organizations to identify inefficiencies and innovate.
- Personalization: In industries like retail and marketing, data analysis helps tailor products and services to meet customer preferences.
As businesses continue to recognize the value of data, the demand for skilled data analysts proficient in Python vs R grows stronger. This evolving demand makes understanding these programming languages crucial for aspiring data professionals.
Python for Data Analysis
Strengths of Python for Data Analysis
Python’s appeal in the realm of data analysis stems from its robust strengths.
- Readability and Simplicity: The straightforward syntax of Python makes it easy to learn and understand, appealing to those who may not have a programming background.
- Versatility: Whether you’re creating web applications, automating tasks, or conducting complex data analyses, Python’s versatility sets it apart.
- Community and Support: Python boasts a vibrant community ready to share insights, tutorials, and resources. This support network helps newcomers navigate challenges efficiently.
As someone who has dabbled with both languages, Python’s approachable nature made it easy to dive into data analysis without being overwhelmed by complex coding terminologies.
Popular Python Libraries for Data Analysis
To maximize its capabilities, Python offers several powerful libraries that streamline the data analysis process. Here are three of the most essential:
Pandas
Pandas is the backbone of data analysis in Python. It’s an open-source library that simplifies data manipulation and analysis through its DataFrame structure. Key features include:
- Data cleaning and preparation
- Merging and joining datasets
- Handling time series data
NumPy
NumPy is fundamental for numerical computing in Python. Its strengths lie in:
- Powerful array operations
- Efficient mathematical functions
- Support for large, multi-dimensional arrays and matrices
Matplotlib
For visualization, Matplotlib stands out as a vital library. It allows users to create compelling static, animated, and interactive visualizations. Features include:
- Simple plotting functions
- Customizable charts and graphs
- Integration with other libraries like Pandas and NumPy
With these powerful tools, Python effectively positions itself as a leading choice for data analysis tasks, setting the stage for deeper exploration and understanding in the field.
R for Data Analysis
Strengths of R for Data Analysis
R has long been a strong contender in the data analysis arena, particularly among statisticians and researchers. Its specific design for statistical computing imparts several noteworthy strengths:
- Statistical Power: R is equipped with a vast portfolio of statistical techniques, making it highly effective for data analysis across various fields.
- Data Visualization Excellence: R excels in producing high-quality visualizations, turning complex data into easily digestible formats.
- Community and Packages: With contributions from a vast community, R has a rich repository of packages tailored for specific analytical needs, enabling users to find solutions for niche problems seamlessly.
As someone who has engaged with data analysis using R, the capability to create stunning visual representations of data never fails to impress. Every visualization brings clarity to insights that would otherwise remain obscured in raw data.
Popular R Packages for Data Analysis
The real strength of R comes from its powerful packages that streamline data analysis tasks. Here are three must-know R packages:
dplyr
dplyr is an essential package for data manipulation, providing a straightforward grammar for data transformation. Features include:
- Filtering rows using conditions
- Renaming and selecting columns effortlessly
- Grouping data for summary calculations
ggplot2
When it comes to data visualization, ggplot2 shines brightly. This package allows users to create advanced and customizable visualizations, such as:
- Scatter plots
- Bar charts
- Histograms
Its layered approach enables users to build complex visualizations in incremental steps, cultivating creativity in data representation.
tidyr
Lastly, tidyr helps with tidying up data, ensuring datasets are structured and easy to work with. Key functionalities include:
- Converting data from wide to long formats
- Filling in missing values
- Nesting data frames for hierarchical data representation
Together, these packages make R a formidable tool for data analysis, equipped to meet the demands of both novice and seasoned analysts alike.
A Comparison of Python and R
When considering which programming language to adopt for data analysis, it’s imperative to understand the distinct attributes of both Python and R. Each language has its unique strengths, and comprehending these differences can significantly influence your decision.
Syntax and Ease of Learning
One of the first things newcomers notice is the syntax.
- Python: Renowned for its clean and readable syntax, Python often feels more intuitive for beginners. As a novice, this simple syntax enabled me to focus more on data analysis rather than getting bogged down by complicated coding.
- R: While R’s syntax may seem less straightforward due to its statistical specialization, it’s designed for in-depth analytics.
With practice, many find R’s syntax just as manageable, especially those focused on statistical analysis.
Performance and Speed
When it comes to performance, both languages have their strengths:
- Python is known for its overall versatility, and while it excels in various applications, it may not always match the raw speed of R in specific statistical computations.
- R shines in statistical routines and provides optimized performance for large datasets, but it may require more memory, which can impact its efficiency in some extensive data scenarios.
Community Support and Job Opportunities
Both communities surrounding Python and R are robust and highly beneficial:
- Python offers immense community support, which translates into a wealth of libraries, frameworks, and tutorials, facilitating easier problem-solving for data analysts.
- R boasts a strong community as well, particularly in academia and research-oriented fields, leading to numerous job opportunities focused on statistical analysis and visualization.
In summary, each language presents compelling advantages depending on the user’s background, project requirements, and career aspirations, making it crucial to weigh options carefully.
Choosing Between Python and R for Data Analysis
As the landscape of data analysis continues to evolve, the decision between Python and R often becomes a pivotal one for data professionals. Understanding the nuances of both can guide you to make the best choice for your specific needs.
Factors to Consider
When deciding between Python and R, several key factors come into play:
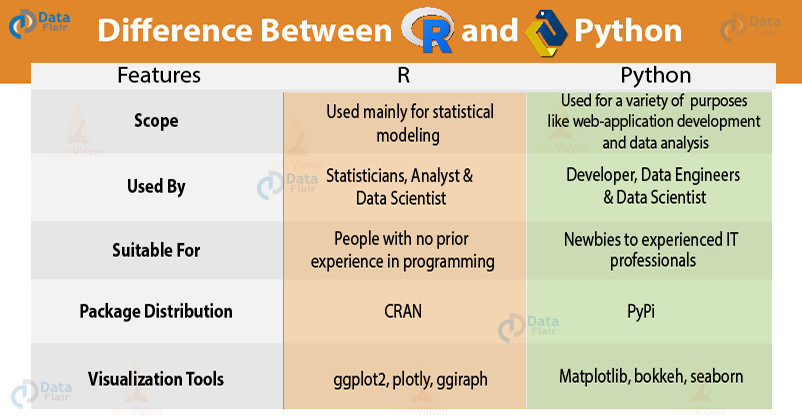
- Your Background: If you have prior programming experience in languages like Java or C++, Python’s syntax may feel more familiar. Conversely, if you come from a statistics background, R’s specialized features may resonate more.
- Project Requirements: Consider the needs of the project at hand. If extensive statistical modeling and specialized visualizations are required, R might be the go-to language. However, for broader applications in web development or data integration, Python could be preferred.
- Career Goals: Reflect on your career aspirations. Python is widely used across many fields, from web development to data science. In contrast, R often holds preference in academic, research, and pure statistical roles.
Use Cases for Python vs. R
Real-world applications can help clarify the choice:
- Python Use Cases:
- Building machine learning models
- Automating data collection processes
- Developing web applications that require data integration
- R Use Cases:
- Advanced statistical analysis in research papers
- Creating detailed visualizations for presentations
- Producing reports that require intricate statistical insights
By aligning your choice with your background, project needs, and career goals, you can determine which language—Python or R—best suits your data analysis journey. This informed decision ultimately optimizes your effectiveness and satisfaction in handling data analysis tasks.
Case Studies: Python vs. R in Data Analysis
In the quest to determine whether Python or R is better suited for data analysis, examining real-world case studies can provide valuable insights. These examples illustrate how each language can meet the needs of diverse analysis projects.
Real-world Examples Comparing Python and R
- Healthcare Analysis:
- R was used in a study assessing patient outcomes based on treatment methods. Its statistical packages like
survivalprovided in-depth analyses of survival curves. - Python, on the other hand, was employed in a project for developing machine learning models to predict disease onset. Libraries like
scikit-learnenabled the creation of effective predictive models, demonstrating both languages’ strengths in distinct parts of health data analysis.
- R was used in a study assessing patient outcomes based on treatment methods. Its statistical packages like
- Financial Analytics:
- In a stock market analysis project, Python was leveraged to perform automated trading strategies, leveraging the capabilities of libraries such as
PandasandQuantConnect. - R was utilized for risk analysis, utilizing
ggplot2for insightful visualizations that highlighted trends and patterns in the financial data.
- In a stock market analysis project, Python was leveraged to perform automated trading strategies, leveraging the capabilities of libraries such as
Which Language to Choose Based on the Case Study
Choosing the right language largely depends on the specifics of the project:
- If the focus lies in statistical modeling, R is arguably more robust with its specialized libraries.
- For tasks requiring machine learning and automation, Python presents a broader ecosystem, making it an ideal choice.
In conclusion, both languages have their unparalleled strengths, and the decision ultimately hinges on the nature of the analysis required. By understanding these case studies, data professionals can make informed choices that drive success in their analyses.
Conclusion
As we wrap up our comparison of Python and R for data analysis, it’s crucial to reflect on the key points we’ve explored throughout this article.
Summary of Comparisons
Both Python and R offer distinct advantages:
- Python is renowned for its simplicity, versatility, and a wide range of applications, making it suitable for beginners and experienced users alike. It excels in machine learning and data integration tasks.
- R, with its rich statistical capabilities and superior data visualization features, is often the language of choice for statisticians and researchers. Its specialized packages cater wonderfully to complex analyses.
In terms of readability, Python holds an edge for those who prefer clear syntax, while R shines in statistical functionalities that are comprehensive out of the box.
Making an Informed Decision Between Python and R
Ultimately, the decision between Python and R hinges on several factors, including:
- Your foundational knowledge and programming background
- The specific requirements of your project
- Long-term career goals and industry demands
Consider your comfort level with each language and the tasks at hand when making your choice. As someone who appreciates the unique strengths of both languages, I recommend starting with the one that aligns most closely with your immediate needs. This experience can later inform your choice for the other language as your skills and projects evolve.
Making an informed decision leads to productive data analysis, whether you choose Python, R, or both—embracing each language’s strengths as you build your data skills.
