

Understanding Model Evaluation Metrics
Accuracy and Precision
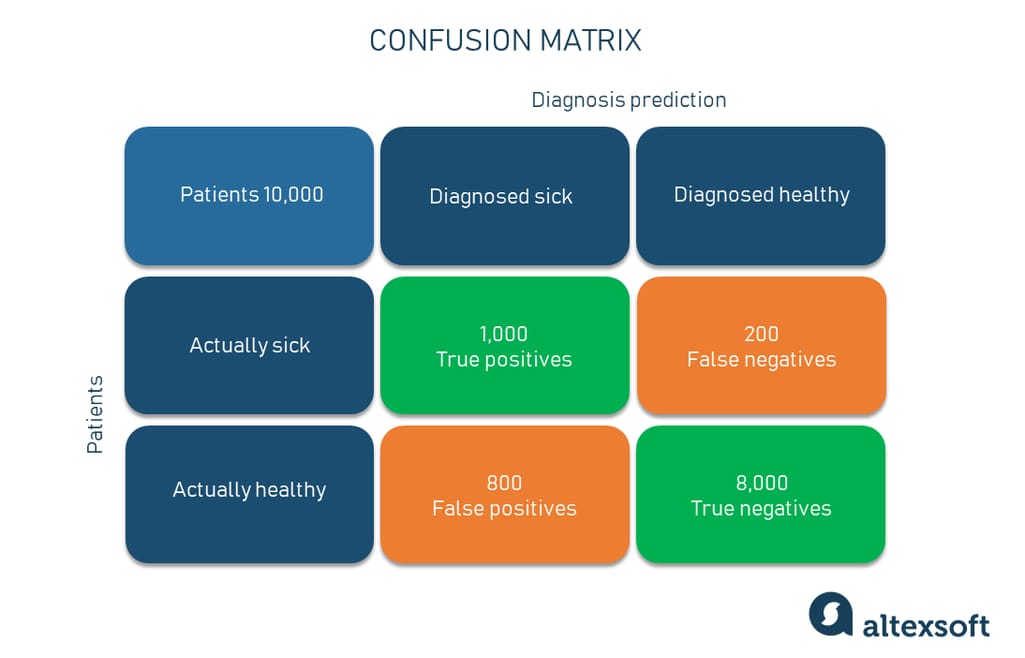
When gauging the effectiveness of machine learning models, accuracy and precision are two metrics that often come into play. Accuracy simply measures the overall correctness of the predictions made by the model. For instance, if a model correctly predicts 90 out of 100 instances, it boasts an accuracy of 90%. However, accuracy alone can be misleading, especially in imbalanced datasets.
- Precision, on the other hand, focuses specifically on the relevancy of the positive predictions. It answers the question, “Of all the instances predicted as positive, how many were actually positive?” For example, if your model identified 80 positive predictions but only 50 were correct, your precision would be 62.5%.
Recall and F1 Score
Next, we come to recall and the F1 score. Recall, often dubbed “sensitivity,” measures the model’s ability to identify all relevant instances. Continuing from our earlier example, if there were 100 actual positive cases and your model identified only 50, the recall would be 50%.
- The F1 score synthesizes precision and recall into one balanced metric. It’s great when you need a single measurement, especially in cases of class imbalance. The formula is:
[
F1 = 2 times left(frac{text{Precision} times text{Recall}}{text{Precision} + text{Recall}}right)
]
A model with a high F1 score indicates that both precision and recall are adequately balanced, which is often the ideal scenario.
ROC Curve and AUC
Finally, the ROC Curve (Receiver Operating Characteristic curve) and AUC (Area Under the Curve) are instrumental in visualizing the trade-off between true positive rates and false positive rates for different thresholds. The ROC Curve plots these rates, helping to assess the model’s performance at various cutoff points.
- The AUC quantifies the overall ability of the model to discriminate between classes. An AUC of 0.5 signifies random guessing, while a score of 1.0 indicates perfect accuracy.
Together, these metrics form the foundation for evaluating machine learning models, providing a comprehensive overview of their performance in real-world applications. Such understanding is vital for anyone who truly wants to dive into how to evaluate the performance of your machine learning models.

Cross-Validation Techniques
K-Fold Cross-Validation
As we dig deeper into model evaluation, it’s crucial to explore cross-validation techniques. One of the most popular methods is K-Fold Cross-Validation. Essentially, this technique involves splitting your dataset into K equal subsets, or folds.
- For instance, if you choose K=5, your data splits into five segments. The model is trained on four of those folds and tested on the remaining one. This process then repeats until every fold has been used as the test set.
This approach not only provides a robust estimate of model performance but also helps mitigate issues of data leakage and overfitting.
Stratified Cross-Validation
Now, if your dataset has imbalanced classes, Stratified Cross-Validation is a game changer. This technique ensures that each fold maintains the same proportion of classes as the entire dataset.
- For example, say you have a dataset with 90% of instances belonging to Class A and 10% to Class B. Stratified cross-validation would ensure that each fold reflects this distribution.
By ensuring classes are represented proportionally, this method improves the model’s ability to generalize, making it especially valuable when dealing with skewed datasets. Understanding these cross-validation techniques equips practitioners, including those reading our blog at TECHFACK, with vital tools to evaluate and enhance their machine learning models effectively.
Overfitting and Underfitting
Bias-Variance Tradeoff
In the realm of model evaluation, understanding overfitting and underfitting is essential. Both issues can compromise model performance, leading to inaccurate predictions. The bias-variance tradeoff is a key concept here.
- Bias refers to the error due to overly simplistic assumptions in the learning algorithm. A high-bias model typically leads to underfitting, as it fails to capture the underlying trends in the data.
- Variance, conversely, pertains to the model’s sensitivity to fluctuations in the training data. Models with high variance tend to grasp the noise rather than the actual signal, resulting in overfitting.
Striking a balance between bias and variance is crucial for developing an effective model.
Regularization Techniques
To tackle these issues, regularization techniques come into play. Regularization methods, such as Lasso and Ridge regression, introduce a penalty for complexity within the model.
- Lasso (L1) Regularization adds a penalty equal to the absolute value of the coefficients, effectively encouraging sparse models.
- Ridge (L2) Regularization imposes a penalty based on the square of the coefficients, which keeps all features in the model but shrinks their values.
By implementing regularization, one can significantly mitigate overfitting and maintain generalization, ensuring the model is both robust and adaptable. It’s these insights that our readers at TECHFACK can apply to fine-tune their models, leading to better performance in practical applications.

Hyperparameter Tuning
Grid Search
Now that we’ve addressed overfitting and underfitting, let’s delve into hyperparameter tuning. This is where the real magic happens in boosting model performance. One popular method for tuning hyperparameters is Grid Search. This technique systematically explores all possible combinations of hyperparameters specified by the user.
- For example, if you wanted to find the best combination of learning rates and depths for a decision tree, you’d create a grid with each parameter value and then train the model for every combination. While comprehensive, this can be computationally expensive, especially with larger datasets.
Despite its thoroughness, Grid Search can sometimes be slower than desired.
Random Search
An alternative to Grid Search is Random Search. This approach randomly selects combinations of hyperparameters to test, which can dramatically reduce computation time while still finding good parameter settings.
- Research has shown that Random Search can outperform Grid Search, particularly when only a few hyperparameters significantly affect model performance.
For instance, if tuning three hyperparameters at once, Random Search could yield satisfactory models without evaluating every possible combination.
Both Grid and Random Search offer powerful ways to improve model accuracy, and incorporating these strategies is essential for anyone looking to refine their machine learning models, as highlighted in our blog at TECHFACK.
Handling Imbalanced Datasets
Resampling Techniques
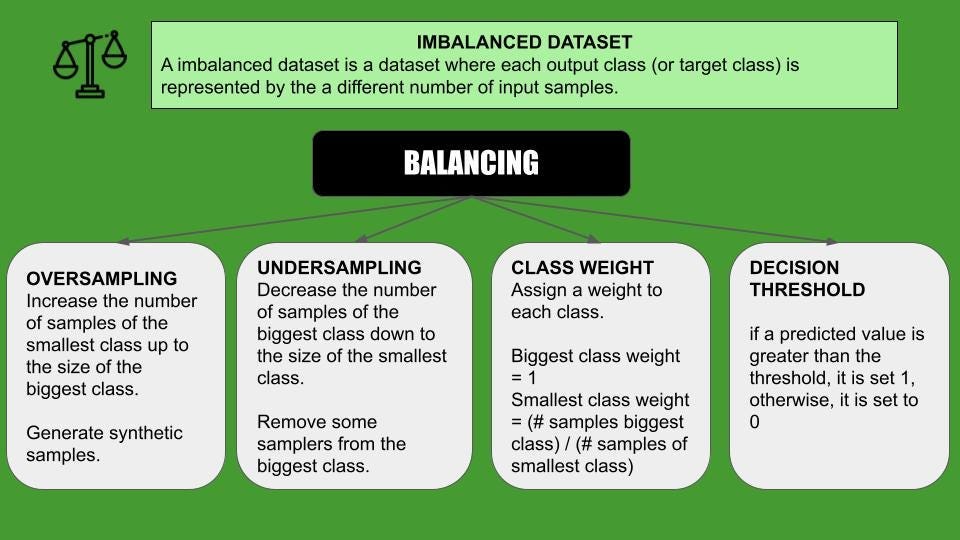
Moving on from hyperparameter tuning, let’s discuss a common challenge in machine learning: imbalanced datasets. When one class outnumbers the other, models can develop a bias towards the majority class. One effective way to address this is through resampling techniques.
- Oversampling involves duplicating instances from the minority class to balance the dataset.
- Undersampling reduces instances from the majority class, but be cautious — this might omit important data!
- Combination methods, like SMOTE (Synthetic Minority Over-sampling Technique), can intelligently create synthetic examples to enhance the minority class without merely replicating data points.
These methods can significantly enhance model performance by ensuring that it learns the characteristics of all classes.
Synthetic Data Generation
In addition to resampling, another approach is synthetic data generation. This technique involves creating entirely new instances based on the existing data, often using advanced algorithms like GANs (Generative Adversarial Networks).
- By generating synthetic samples, practitioners can enrich the minority class without risking overfitting through data duplication.
- This method allows models to learn more nuanced patterns and relationships, ultimately leading to better predictive performance.
Understanding how to tackle imbalanced datasets is critical for anyone aspiring to build effective machine learning models, and readers of TECHFACK can confidently apply these techniques in their work.

Interpretability of Models
Feature Importance
As we transition into the interpretability of machine learning models, understanding feature importance is key. This metric provides insights into which features contribute most to a model’s predictions. By evaluating feature importance, developers can make informed decisions about which variables to focus on.
- For example, if you’re building a model to predict home prices, knowing that square footage holds significant importance can guide real estate assessments.
- Typically, tree-based models provide built-in feature importance scores, but other algorithms like linear regression can be examined through coefficients.
This awareness not only helps in refining models but also boosts transparency when presenting results to stakeholders.
SHAP Values
To deepen the understanding of model decisions, SHAP (SHapley Additive exPlanations) values come into play. SHAP values offer a unified measure of feature contributions, helping to explain individual predictions by quantifying the contribution of each feature.
- For instance, SHAP values can illustrate that the increase in a feature, like the number of bedrooms, leads to a specific increase in the predicted house price for individual cases.
- This level of granularity allows practitioners to grasp the “why” behind model decisions – an invaluable asset in fields such as finance or healthcare, where accountability is paramount.
Incorporating feature importance and SHAP values prepares data scientists and stakeholders alike for meaningful conversations regarding model outputs, enhancing the machine learning journey explored in our blog at TECHFACK.
Deployment and Monitoring
Building Pipelines
As we move from interpretability to the practical aspects of machine learning, deployment and monitoring are crucial steps in the journey. The first phase in this process involves building pipelines.
- A well-structured pipeline automates data collection, preprocessing, model training, and deployment. For instance, a typical pipeline might include stages such as data input, feature extraction, model selection, and evaluation.
- Utilizing tools like Apache Airflow or Kubeflow can streamline this workflow, enabling seamless transitions from one step to the next.
By constructing efficient pipelines, data scientists can focus more on refining models rather than getting bogged down in repetitive tasks.
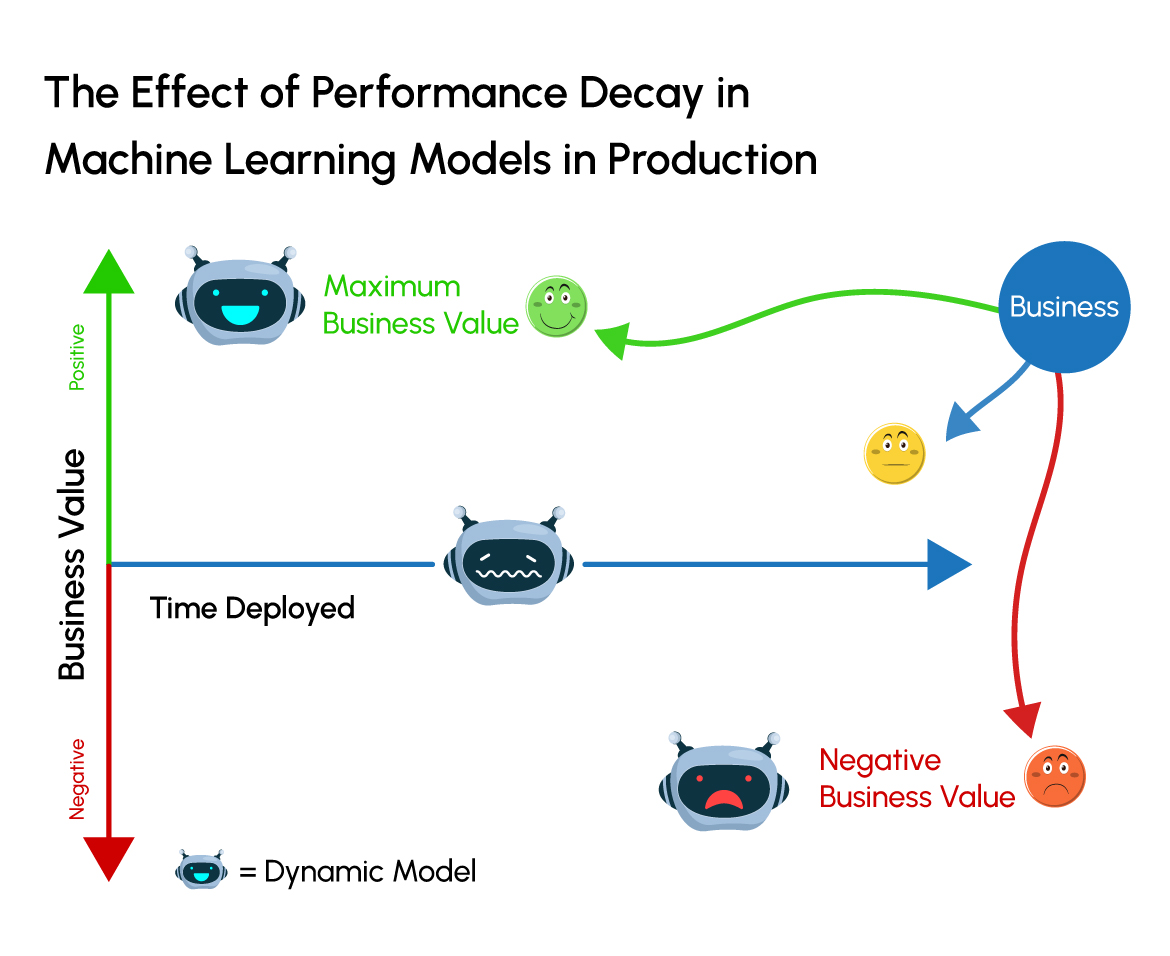
Monitoring Model Performance
Once models are deployed, the next essential task is monitoring model performance. This ensures that the model maintains its accuracy and effectiveness over time.
- Key performance indicators (KPIs) can include metrics like accuracy, precision, and recall, monitored in real-time to catch any deterioration in the model’s predictions.
- Setting up alerts for when performance dips can prompt immediate investigation, allowing teams to swiftly take corrective actions.
With a solid deployment strategy and ongoing performance monitoring, teams can ensure their machine learning projects deliver value consistently. As emphasized in our blog at TECHFACK, these practices help build trust in AI applications, ultimately fostering wider acceptance and utilization.
Case Studies and Examples
Real-World Applications
Now that we’ve explored the intricacies of deployment and monitoring, let’s delve into case studies and examples that demonstrate the power of machine learning in action. Various industries leverage these technologies, driving significant advancements.
- Healthcare: Machine learning models predict patient outcomes, leading to personalized treatment plans. For instance, using predictive analytics, hospitals have improved patient management and reduced readmission rates.
- Finance: Credit scoring models use historical data to assess loan applicants, enabling financial institutions to minimize risk effectively.
These real-world applications showcase the broad potential of machine learning technologies.
Model Evaluation in Action
In each of these cases, model evaluation plays a pivotal role in ensuring accuracy and reliability. For example, a healthcare provider might implement cross-validation methods to confirm that their patient outcome model performs well across diverse data sets.
- Continuous monitoring of model performance metrics, like accuracy and recall, gives stakeholders insights into model reliability.
- Regular evaluations help organizations refine their models, leading to more effective interventions.
By highlighting these real-world applications and evaluation practices, our blog at TECHFACK illustrates how machine learning can drive innovation and efficiency across various sectors, fostering a future where data-driven decisions lead the way.
